Unlock the Secrets to Solving Quadratic Equations: Avoid Common Mistakes and Master SAT Mathematics

When solving quadratic equations, students often make common mistakes while working through the steps. Let’s break down how to properly solve quadratic equations and avoid these mistakes.

  1. General Form of a Quadratic Equation
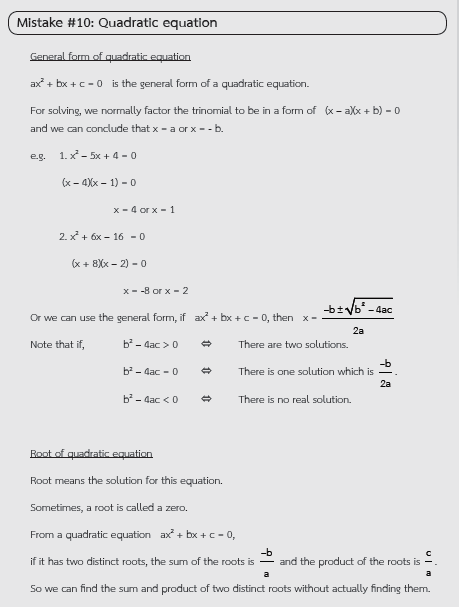
    A quadratic equation is in the general form of ax² + bx + c = 0. To solve this equation, we typically factor the trinomial into a product of two binomials, such as (x – a)(x + b) = 0. This allows us to find that x = a or x = -b. A common mistake is failing to properly factor the trinomial or incorrectly identifying the factors.
  2. Solving by Factoring
    For example, in the quadratic equation x² – 5x + 4 = 0, we can factor it into (x – 4)(x – 1) = 0. The solutions are x = 4 or x = 1. Similarly, for x² + 6x – 16 = 0, we can factor it into (x + 8)(x – 2) = 0, giving solutions x = -8 or x = 2. A common mistake is missing a factor or incorrectly simplifying the equation.
  3. Using the Quadratic Formula
    If factoring is difficult or not possible, we can use the quadratic formula:
    x = [-b ± √(b² – 4ac)] / 2a.
    This formula can be used when the quadratic equation is in the form ax² + bx + c = 0. A key mistake is incorrectly substituting the values for a, b, and c, which can lead to wrong answers.
  4. Discriminant Analysis
    The value under the square root in the quadratic formula is called the discriminant (b² – 4ac). The discriminant helps determine the number and type of solutions:
    • If b² – 4ac > 0, there are two real solutions.
    • If b² – 4ac = 0, there is one real solution.
    • If b² – 4ac < 0, there are no real solutions.
      A common mistake is miscalculating the discriminant, which leads to an incorrect conclusion about the number of solutions.
  5. Roots of the Quadratic Equation
    The roots of the quadratic equation are the solutions to the equation. Sometimes, a root is called a zero because it represents the x-value where the equation equals zero. The sum of the roots of the equation ax² + bx + c = 0 is -b/a, and the product of the roots is c/a. A common mistake is not using these relationships correctly, leading to errors in solving the equation.

By understanding these common mistakes and knowing how to apply the quadratic formula and factor correctly, you can solve quadratic equations with confidence and avoid errors. Always check your discriminant and ensure you’re following the correct steps when solving quadratic equations.

Ready to level up your skills? Learn more and practice with our book! Order it now.

พร้อมจะฝึกเพิ่มเติมหรือยัง? อ่านสรุปจุดผิดทั้งหมดและฝึกทำโจทย์จากหนังสือของเรา!

สั่งซื้อหนังสือ

Common Mistakes in Solving Circle Equations and How to Master Center-Radius Form for SAT Mathematics

When solving problems involving circles, students often make common mistakes when interpreting and converting equations. Let’s break down how to avoid these mistakes and properly handle circle equations.

  1. Understanding the General Form of a Circle Equation
    A circle is a relation between x and y, both of degree 2. The general form of a circle equation is written as x² + y² + ax + by + c = 0. In this form, the center of the circle is at (-a/2, -b/2) and the radius can be calculated once the equation is rewritten correctly. A common mistake is not correctly recognizing the center and radius from the general form.

  2. Converting to Center-Radius Form
    The center-radius form of the equation is (x – h)² + (y – k)² = r², where (h, k) is the center and r is the radius. To convert the general form into this format, students often need to complete the square on both x and y terms. A typical mistake is skipping the completing the square process or making errors while solving for the center and radius.

  3. Example of Completing the Square
    Let’s take the example x² + y² + 6x – 8y – 11 = 0. To convert this into center-radius form, first complete the square:
    x² + 6x → (x + 3)²
    y² – 8y → (y – 4)²
    After completing the square and simplifying, you get (x + 3)² + (y – 4)² = 36. The center is (-3, 4) and the radius is 6. A common mistake here is either not completing the square correctly or missing the step of factoring the equation properly.

  4. Unit Circle
    It’s important to note that the equation x² + y² = 1 represents a unit circle, which has its center at (0, 0) and a radius of 1. Misunderstanding this equation can lead to errors in identifying the properties of the unit circle and its graph.

By understanding these common mistakes and knowing how to correctly complete the square and convert equations into center-radius form, you can accurately solve problems related to circles. Always make sure to carefully complete the square, recognize the center and radius, and apply these steps to solve circle equations with confidence.

Ready to level up your skills? Learn more and practice with our book! Order it now.

พร้อมจะฝึกเพิ่มเติมหรือยัง? อ่านสรุปจุดผิดทั้งหมดและฝึกทำโจทย์จากหนังสือของเรา!

สั่งซื้อหนังสือ

Common Mistakes in Graphing Absolute Value Functions – Key Insights for SAT Mathematics

When dealing with absolute value graphs, students often make common mistakes in interpreting and sketching these graphs. Below is a breakdown of how to correctly understand and graph absolute value functions while avoiding common mistakes.

  1. Understanding the Basic Absolute Value Graph
    The graph of y = |x| or f(x) = |x| is a V-shaped graph with its vertex at the origin (0,0). The graph is symmetric around the vertical line called the axis of symmetry. This graph opens upwards, forming two straight lines. A common mistake is misinterpreting the slope or symmetry of the graph.

  2. Negative Absolute Value Graph
    The graph of y = -|x| or f(x) = -|x| is an inverted V-shaped graph. This graph also has its vertex at the origin, but it opens downward. The axis of symmetry remains the same, but the graph now slopes downward on both sides. A common mistake here is misinterpreting the orientation of the graph and thinking it opens upwards.

  3. Graphing Transformed Absolute Value Functions
    When the absolute value function is written in the form y = a|x – h| + k, the graph can be shifted and stretched depending on the values of a, h, and k.

    • If a > 0, the graph opens upward, with the vertex at (h, k).
    • If a < 0, the graph opens downward, with the vertex still at (h, k).
      A common mistake is misunderstanding how the value of a affects the direction the graph opens, or not recognizing that the vertex shifts based on h and k.
  4. Absolute Value Graph Similar to Parabola
    An important note is that the absolute value graph is similar to the graph of a parabola, but with straight lines instead of curves. The graph of y = |x| and the graph of y = ax^2 both have a vertex and symmetry, but the parabola curves, while the absolute value graph has straight lines. A common mistake is confusing the two types of graphs and not recognizing the linearity of the absolute value graph.

By understanding these key points and common mistakes, you can more easily graph absolute value functions and correctly interpret their transformations. Always pay attention to the vertex, axis of symmetry, and the direction in which the graph opens based on the value of a.

Ready to level up your skills? Learn more and practice with our book! Order it now.

พร้อมจะฝึกเพิ่มเติมหรือยัง? อ่านสรุปจุดผิดทั้งหมดและฝึกทำโจทย์จากหนังสือของเรา!

สั่งซื้อหนังสือ

Common Mistakes in Solving Absolute Inequalities and How to Solve Them Correctly

When working with absolute inequalities, students often encounter common mistakes that can lead to confusion and incorrect solutions. Understanding how to approach and solve these inequalities correctly is crucial. Let’s break down the types of absolute inequalities and how to avoid the typical errors that students make when solving them.

1. Understanding Absolute Value Less Than a Positive Number

The first type of absolute inequality involves the absolute value of a number being less than a given positive value. In this case, the solution is a range that lies between the negative and positive value of the number. For example, if |x| < a, it means -a < x < a. A common mistake here is misinterpreting this inequality, leading students to either miss out on values or fail to properly solve the range of solutions.

2. Handling Absolute Value Greater Than a Positive Number

Next, when the absolute value of a number is greater than a positive value, the solution implies that the number is either greater than the positive value or less than the negative value. For example, if |x| > a, the solution is x > a or x < -a. This results in two separate conditions that must be solved independently. A frequent mistake is failing to break the inequality into these two parts, which leads to an incomplete or incorrect solution.

3. Inequalities with Less Than or Equal to (≤)

When the absolute value of a number is less than or equal to a given value, the solution includes all values between the negative and positive values, including the boundaries. For example, if |x| ≤ a, the solution is -a ≤ x ≤ a. Students sometimes make the mistake of not properly including the boundary values or misinterpreting the range, which can lead to an incorrect solution.

4. Example of Solving Absolute Inequalities

Consider the inequality |2x + 3| ≥ 5. This should be broken down into two separate cases:
Case 1: 2x + 3 ≥ 5
Case 2: 2x + 3 ≤ -5

Each case should be solved separately, and the final solution is the union of both results. A common mistake is either failing to solve one part of the inequality or solving it incorrectly, which results in an incomplete or incorrect answer.

5. Key Tips for Solving Absolute Inequalities

  • Always break the inequality into separate cases: For inequalities involving greater than or less than, remember to split the problem into two conditions and solve them independently.
  • Pay attention to boundary values: When the inequality is less than or equal to, ensure that you include the boundary values in your solution.
  • Double-check your work: After solving each case, review the solutions to ensure both parts are considered correctly.

By understanding these common mistakes and knowing how to handle each situation properly, you can solve absolute inequalities confidently and accurately. Always remember to break down the inequality correctly and consider both possible solutions for inequalities involving absolute values.

Ready to level up your skills? Learn more and practice with our book! Order it now.

พร้อมจะฝึกเพิ่มเติมหรือยัง? อ่านสรุปจุดผิดทั้งหมดและฝึกทำโจทย์จากหนังสือของเรา!

สั่งซื้อหนังสือ

Common Mistakes in SAT Math Pythagorean Theorem

Examples of Common Mistakes in SAT Math – Pythagorean Theorem Tips from STUDYPLAN


Common Mistakes with the Pythagorean Theorem

The Pythagorean Theorem, a fundamental concept in geometry, is essential for solving right triangle problems on the SAT Math section. While the formula c2 = a2 + b2 (where c is the hypotenuse and a and b are the legs) is simple, students often make several common mistakes when applying it. Here’s a breakdown of these errors and how to avoid them:

1. MISIDENTIFYING THE HYPOTENUSE

A frequent mistake is confusing the hypotenuse with one of the legs. Remember, the hypotenuse is always the longest side, opposite the right angle. When using the Pythagorean Theorem, ensure you’re correctly identifying which side is the hypotenuse.

2. INCORRECTLY USING TRIGONOMETRIC RATIOS

Trigonometric functions like sine, cosine, and tangent are often used in SAT Math problems, but students can mistakenly apply them without understanding their proper relationships in a right triangle. The sine of an angle is the ratio of the opposite side to the hypotenuse, the cosine is the ratio of the adjacent side to the hypotenuse, and the tangent is the ratio of the opposite side to the adjacent side. These relationships are used to find missing sides or angles but should not replace the Pythagorean Theorem when solving for a side in a right triangle.

3. FAILING TO RECOGNIZE SPECIAL RIGHT TRIANGLES

Certain triangles, such as the 3-4-5 or 5-12-13 triangles, are commonly seen in SAT Math problems. Students may overlook these familiar patterns and attempt to apply the theorem in a more complicated manner. Always recognize when a right triangle follows a well-known pattern to save time.

4. FORGETTING TO APPLY THE THEOREM CORRECTLY IN WORD PROBLEMS

In word problems, it’s easy to misinterpret the question and forget to apply the Pythagorean Theorem correctly. Ensure you’re using the theorem only when the question involves a right triangle, and carefully assign the correct values to a, b, and c.

5. CONFUSING TRIGONOMETRIC FUNCTIONS WITH RECIPROCAL FUNCTIONS

Sometimes, students incorrectly swap trigonometric functions for their reciprocals. For instance, the cosecant is the reciprocal of sine, the secant is the reciprocal of cosine, and the cotangent is the reciprocal of tangent. These should only be used when explicitly required by the question and should not replace basic geometric principles like the Pythagorean Theorem.

CONCLUSION

The Pythagorean Theorem is a key tool in SAT Math, but to use it effectively, students must avoid common mistakes like misidentifying sides, misusing trigonometric ratios, and overlooking special triangles. Practice identifying the right triangles and applying the formula correctly to improve your SAT Math performance.


Ready to level up your skills? Learn more and practice with our book! Order it now.

พร้อมจะฝึกเพิ่มเติมหรือยัง? อ่านสรุปจุดผิดทั้งหมดและฝึกทำโจทย์จากหนังสือของเรา!

สั่งซื้อหนังสือ

จุดผิดที่พบบ่อยในการสอบบทค่าสัมบูรณ์จากหนังสือ STUDYPLAN MATHEMATICS

สรุปสูตรสมบัติของค่าสัมบูรณ์และการประยุกต์ใช้

การใช้สมบัติของค่าความสัมบูรณ์ในคณิตศาสตร์เป็นเรื่องที่สำคัญ เนื่องจากสามารถช่วยให้การแก้สมการหรือการเปลี่ยนแปลงสมการต่างๆ ง่ายขึ้น นอกจากนี้ยังสามารถใช้ในการคำนวณและการแยกตัวแปรได้อย่างมีประสิทธิภาพ

  1. สมบัติของค่าความสัมบูรณ์

    • |a| = |b| และ |a – b| = |b – a|
      โดยการใช้สมบัตินี้จะช่วยให้การทำงานกับค่าความสัมบูรณ์ง่ายขึ้น เช่น |7 – x| สามารถเขียนเป็น |x – 7| ได้เพื่อให้สะดวกต่อการแก้สมการหรือสมการต่อไป
  2. สมบัติของค่ารากที่สอง

    • √A² = |A|
    • เช่น √x² = |x| หรือ √(x-5)² = |x-5|
      โดยในกรณีนี้เราจะเห็นได้ว่า √A² = A เมื่อ A ≥ 0 เช่น √x² = x เมื่อ x ≥ 0 หรือ √(x-5)² = x – 5 เมื่อ x ≥ 5
  3. สมบัติการคูณของค่าความสัมบูรณ์

    • ค่าความสัมบูรณ์สามารถกระจายไปในฟังก์ชันคูณหารได้ เช่น
      |A / C| = |A| / |C|
      ตัวอย่าง: |x² – 3x – 10| = |(x – 5)(x + 2)|
      โดยในกรณีนี้การใช้สมบัตินี้จะช่วยให้สามารถแยกตัวแปรได้ง่ายขึ้น เช่น |x – 5| × |x + 2|

การใช้สมบัติของค่าความสัมบูรณ์เป็นเครื่องมือสำคัญในการทำความเข้าใจเกี่ยวกับสมการและการแก้ปัญหาทางคณิตศาสตร์ โดยสามารถช่วยให้การคำนวณในหลายๆ เรื่องเป็นไปอย่างมีประสิทธิภาพมากยิ่งขึ้น

พร้อมจะฝึกเพิ่มเติมหรือยัง? อ่านสรุปจุดผิดทั้งหมดและฝึกทำโจทย์จากหนังสือของเรา!

สั่งซื้อหนังสือ

จุดผิดที่พบบ่อยในบทฟังก์ชันจากหนังสือ STUDYPLAN MATHEMATICS

สรุปฟังก์ชันจาก A ไป B

ฟังก์ชัน (Function) คือ ความสัมพันธ์ระหว่างสองเซต ที่กำหนดให้ค่าจากเซต A ไปยังเซต B โดยฟังก์ชันจะต้องมีเงื่อนไข 3 ข้อที่สำคัญในการกำหนด

  1. เป็นแถวคู่อันดับที่ x ไป y และให้ 1 คำตอบ
    ฟังก์ชันจะต้องเป็นความสัมพันธ์ระหว่างแต่ละค่าจาก A และ B โดยที่ทุกค่าจาก A จะต้องตรงกับค่าหนึ่งใน B เท่านั้น

  2. โดเมนของ f ต้องเป็น A
    โดยที่ Df = A คือ ทุกค่าจาก A ต้องสามารถหาค่าใน B ได้

  3. เรนจ์ของ f ต้องเป็นสมาชิกของ B
    โดยที่ Rf ⊆ B การแปลงค่าจาก A ไปยัง B ต้องให้ผลลัพธ์ในเซต B เท่านั้น

ฟังก์ชันมี 2 ประเภทสำคัญ:

  • ฟังก์ชันทั่วไป (Onto Function)
    ฟังก์ชันที่ให้ค่าจาก A ไปยัง B โดยที่ทุกค่าของ B จะต้องมีค่าจาก A ที่ทำให้ค่าดังกล่าวเป็นจริง

  • ฟังก์ชัน 1 ต่อ 1 (One to One Function)
    ฟังก์ชันที่ค่าจาก A ไปยัง B โดยที่ค่าจาก A จะไม่ซ้ำกันใน B ซึ่งเรียกว่าเป็นฟังก์ชันที่มีลักษณะเฉพาะ

อินเวอร์สของฟังก์ชัน: อินเวอร์ส (f⁻¹) คือ ฟังก์ชันที่ย้อนกลับจาก B ไป A เช่นเดียวกับการพลิกค่าจากเซตหนึ่งไปยังอีกเซตหนึ่ง

ข้อสังเกต: ฟังก์ชัน f⁻¹ จะเป็นฟังก์ชัน 1 ต่อ 1 เมื่อฟังก์ชัน f เป็นฟังก์ชัน 1 ต่อ 1 เท่านั้น

พร้อมจะฝึกเพิ่มเติมหรือยัง? อ่านสรุปจุดผิดทั้งหมดและฝึกทำโจทย์จากหนังสือของเรา!

สั่งซื้อหนังสือ

ตัวอย่างจุดผิดที่พบบ่อยบทตรีโกณมิติจากหนังสือ STUDYPLAN MATHEMATICS

สรุปเครื่องหมายของฟังก์ชันตรีโกณมิติ

ฟังก์ชันตรีโกณมิติมีเครื่องหมายที่แตกต่างกันขึ้นอยู่กับตำแหน่งของมุมในแต่ละควอแดรนต์ (Q1, Q2, Q3, Q4) ซึ่งฟังก์ชันตรีโกณมิติหลักมีดังนี้:

  1. ใน Q1 (1st Quadrant):

    • sin(θ), cos(θ), tan(θ) เป็นบวก
    • sec, cosec, cot เป็นบวก
  2. ใน Q2 (2nd Quadrant):

    • sin(θ) เป็นบวก
    • cos(θ), tan(θ) เป็นลบ
    • sec, cosec เป็นบวก, cot เป็นลบ
  3. ใน Q3 (3rd Quadrant):

    • sin(θ), cos(θ) เป็นลบ
    • tan(θ) เป็นบวก
    • sec, cosec เป็นลบ, cot เป็นบวก
  4. ใน Q4 (4th Quadrant):

    • sin(θ) เป็นลบ
    • cos(θ) เป็นบวก
    • tan(θ) เป็นลบ
    • sec, cosec เป็นลบ, cot เป็นบวก

การตีความฟังก์ชัน:

  • sin ใช้ในการแสดงความยาวตามแกน y
  • cos ใช้ในการแสดงความยาวตามแกน x
  • tan ใช้ในการแสดงความชันของรัศมีวงกลม
  • sec, cosec, cot เป็นฟังก์ชันที่ใช้ในการแปลงค่าต่าง ๆ ตามลำดับ

พร้อมจะฝึกเพิ่มเติมหรือยัง? อ่านสรุปจุดผิดทั้งหมดและฝึกทำโจทย์จากหนังสือของเรา!

สั่งซื้อหนังสือ

จุดผิดที่พบบ่อยเรื่องพื้นที่ปิดล้อมจากหนังสือ STUDYPLAN MATHEMATICS

การหาพื้นที่ใต้กราฟของฟังก์ชันในแคลคูลัส (Integration) จะใช้วิธีการหาพื้นที่ใต้กราฟที่ถูกกำหนดด้วยขอบเขตบนและล่าง โดยการทำอินทิเกรตของฟังก์ชันภายในขอบเขตที่กำหนด ซึ่งจะช่วยคำนวณพื้นที่ที่ถูกครอบคลุมโดยกราฟของฟังก์ชัน

  1. พื้นที่ที่อยู่เหนือแกน x
    เมื่ออินทิเกรตจาก a ถึง b ของฟังก์ชัน f(x)dx จะให้ค่าพื้นที่บวก เพราะพื้นที่จะอยู่เหนือแกน x

  2. พื้นที่ที่อยู่ใต้แกน x
    เมื่ออินทิเกรตจาก a ถึง b ของฟังก์ชัน f(x)dx จะให้ค่าพื้นที่ลบ เพราะพื้นที่จะอยู่ใต้แกน x

  3. พื้นที่ที่อยู่ระหว่างกราฟสองฟังก์ชัน
    เมื่ออินทิเกรตจาก a ถึง c ของฟังก์ชัน f(x)dx จะไม่ให้พื้นที่ที่ระหว่างกราฟที่ถูกต้อง เนื่องจากการอินทิเกรตจะนำพื้นที่ที่เป็นบวกและลบมาคำนวณรวมกัน

การใช้อินทิเกรตจะช่วยให้เราได้ค่าพื้นที่ใต้กราฟของฟังก์ชันในแต่ละช่วงโดยการทำการคำนวณกับขอบเขตที่ถูกกำหนด

พร้อมจะฝึกเพิ่มเติมหรือยัง? อ่านสรุปจุดผิดทั้งหมดและฝึกทำโจทย์จากหนังสือของเรา!

สั่งซื้อหนังสือ

การวัดการกระจายข้อมูลในสถิติ ส่วนที่ 2

สรุปการวัดการกระจายข้อมูลในสถิติ: ส่วนเบี่ยงเบนมาตรฐาน (Standard Deviation)

การคำนวณส่วนเบี่ยงเบนมาตรฐาน (Standard Deviation) คือวิธีที่ใช้วัดความแปรปรวนหรือการกระจายตัวของข้อมูลในชุดข้อมูลหนึ่ง ๆ โดยมันจะช่วยให้เราทราบว่าข้อมูลในชุดนั้นกระจายตัวมากหรือน้อยจากค่าเฉลี่ย (mean) โดยสูตรการคำนวณคือ

S.D. = √ (Σ(xi – x̄)² / N)

สูตรนี้หมายความว่าเราเอาค่าของแต่ละข้อมูล (xi) มาหักลบกับค่าเฉลี่ย (x̄) แล้วยกกำลังสอง จากนั้นนำผลลัพธ์ทั้งหมดมารวมกัน (Σ) และหารด้วยจำนวนข้อมูลทั้งหมด (N) ก่อนจะหาค่ารากที่สองของผลลัพธ์นั้น.

ข้อสังเกต:

  • ถ้าส่วนเบี่ยงเบนมาตรฐานสูงแสดงว่าข้อมูลในชุดนั้นกระจายตัวมาก
  • ถ้าส่วนเบี่ยงเบนมาตรฐานต่ำแสดงว่าข้อมูลในชุดนั้นกระจายตัวน้อย

พร้อมจะฝึกเพิ่มเติมหรือยัง? อ่านสรุปจุดผิดทั้งหมดและฝึกทำโจทย์จากหนังสือของเรา!

สั่งซื้อหนังสือ

การวัดการกระจายข้อมูลในสถิติ ส่วนที่ 1

แค่เห็นชื่อก็มึนแล้ว แต่ถ้าจำทุกตัวได้ ออกตัวไหนมาก็ไม่หวั่น จำต่อตามภาพกันเลย

การวัดการกระจายข้อมูลในสถิติ 1

การวัดการกระจายของข้อมูลคือกระบวนการที่ใช้ในการวิเคราะห์ว่า ข้อมูลชุดหนึ่งกระจายตัวอย่างไรในลักษณะต่างๆ โดยการวัดนี้ช่วยให้เราทราบถึงความแตกต่างของข้อมูลแต่ละชุด และช่วยในการทำความเข้าใจลักษณะของข้อมูลได้ดีขึ้น ในการวัดการกระจายข้อมูลในสถิติ 1 มี 2 ส่วนหลักคือ สัมบูรณ์ และ สัมพัทธ์ โดยมีรายละเอียดดังนี้:

สัมบูรณ์ (Absolute Measure)

การวัดในลักษณะสัมบูรณ์คือการวัดที่ใช้หน่วยเดียวกับข้อมูล เพื่อให้เราเห็นภาพรวมของการกระจายตัวในเชิงปริมาณ มีดังนี้:

พิสัย: พิสัยคือการคำนวณค่าความแตกต่างระหว่างค่ามากที่สุดและค่าน้อยที่สุดในชุดข้อมูล ช่วยให้เราทราบถึงความแตกต่างสูงสุดในข้อมูล.

ส่วนเบี่ยงเบนควอไทล์: คือการคำนวณค่าความแตกต่างของข้อมูลระหว่างควอไทล์ที่ 1 (Q1) และควอไทล์ที่ 3 (Q3) ซึ่งช่วยให้เราเห็นความแตกต่างของข้อมูลในช่วงกลาง.

ส่วนเบี่ยงเบนเฉลี่ย: การคำนวณโดยการหาค่าผิดปกติหรือความแตกต่างเฉลี่ยจากค่าเฉลี่ยของข้อมูลทั้งหมด.

ส่วนเบี่ยงเบนมาตรฐาน: การวัดการกระจายที่คำนวณจากการหาค่ารากที่สองของค่าเฉลี่ยของความเบี่ยงเบนทั้งหมด เพื่อให้เราเข้าใจว่าแต่ละค่าผิดปกติห่างจากค่าเฉลี่ยมากน้อยเพียงใด.

สัมพัทธ์ (Relative Measure)

การวัดในลักษณะสัมพัทธ์คือการวัดความสัมพันธ์ระหว่างการกระจายของข้อมูล โดยเปรียบเทียบกับค่าอื่นๆ ที่มีการเปลี่ยนแปลงร่วมกัน มีดังนี้:

สัมประสิทธิ์ของพิสัย: ใช้การเปรียบเทียบพิสัยของข้อมูลกับค่าเฉลี่ย เพื่อให้เราเข้าใจถึงการกระจายข้อมูลในเชิงสัมพัทธ์.

สัมประสิทธิ์ของส่วนเบี่ยงเบนควอไทล์: การคำนวณในรูปแบบของการเปรียบเทียบความแตกต่างของส่วนเบี่ยงเบนควอไทล์กับค่าเฉลี่ย เพื่อดูว่าแต่ละช่วงของข้อมูลมีการกระจายตัวมากน้อยเพียงใด.

สัมประสิทธิ์ของส่วนเบี่ยงเบนมาตรฐาน: การคำนวณความสัมพันธ์ของส่วนเบี่ยงเบนมาตรฐานต่อค่าเฉลี่ยของข้อมูล โดยบ่งบอกถึงความกว้างของการกระจายข้อมูล.

สัมประสิทธิ์ของความแปรผัน: เป็นการใช้การวัดการกระจายที่ใช้กับข้อมูลเชิงสัมพัทธ์ เพื่อดูถึงการกระจายของข้อมูลเมื่อเปรียบเทียบกับค่าที่มีความแปรผัน.

สรุป

การวัดการกระจายข้อมูลในสถิติ 1 เป็นเครื่องมือสำคัญที่ช่วยให้เราเข้าใจลักษณะการกระจายของข้อมูล ทั้งในเชิงสัมบูรณ์และสัมพัทธ์ การใช้เครื่องมือเหล่านี้จะช่วยให้การวิเคราะห์ข้อมูลเป็นไปอย่างมีประสิทธิภาพมากยิ่งขึ้น โดยเน้นการเปรียบเทียบข้อมูลในแต่ละชุดและการตรวจสอบความเบี่ยงเบนเพื่อหาค่าที่สำคัญในการประเมินผล.

พร้อมจะฝึกเพิ่มเติมหรือยัง? อ่านสรุปจุดผิดทั้งหมดและฝึกทำโจทย์จากหนังสือของเรา!

สั่งซื้อหนังสือ

รู้จักสูตรของอนุกรม

check point อนุกรมแบบต่าง ๆ ลืมอันไหน ดูต่อในภาพกันเลย

พร้อมจะฝึกเพิ่มเติมหรือยัง? อ่านสรุปจุดผิดทั้งหมดและฝึกทำโจทย์จากหนังสือของเรา!

สั่งซื้อหนังสือ